By Maggie Twaroski, Truth Tree Contributor
If you’re like most school marketers, you probably have mixed feelings about using data to drive your enrollment marketing decisions. On the one hand, you know how valuable data is in revealing insights into your audience, content, and campaigns. On the other hand, collecting and utilizing data can be complicated.
Maybe you don’t have enough data to work with, so you end up making assumptions and hoping for the best. Or maybe you have too much data, and you’re struggling to organize it into actionable marketing strategies.
That’s why so many schools are leaving a portion of their enrollment marketing up to chance—they either don’t have enough data, or they have a surplus and don’t have the time or resources to organize it all.
Fortunately, collecting and utilizing your multi-channel marketing becomes much simpler when you have the right strategy in place (and the tools to back it up).
Let’s unpack five ways you can use data to help your enrollment marketing efforts.
1. Collect Quantitative and Qualitative Insights
When you think of data in enrollment marketing, you probably envision quantifiable metrics like your number of website visitors, bounce rates, click-through rates, and impressions. These are all critical measurements in enrollment marketing, but you shouldn’t stop there. You’ll also want to look at qualitative data to help answer more nuanced questions about your audience, website analytics, and campaign performance.
Enrollment marketing is largely influenced by your audience’s intent, behavior, and pain points. In these terms, qualitative data may often reveal more than quantitative data can. Why did your prospects visit a particular page on your site? Why did they search for a particular keyword? What are their current concerns or pain points? Deciphering these qualitative metrics can help answer the more open-ended questions of your prospects’ behavior that can influence your enrollment marketing.
Some of this data can be easily extrapolated in tools you’re already using, like your CRM or Google Analytics. But it’s also worth looking at “out of the box” sources like surveys, interviews, conferences, and forums. For example, you might discover that school-home communication is a top priority coming up in survey responses. You can use that information to create an ad or email highlighting your mobile app’s communication features, then target it to prospective families who likely have the same priority.
2. Know Your Audience
Knowing your audience is a critical step in creating marketing materials that attract and nurture them. Collecting audience data not only allows you to create more targeted campaigns, it also helps you determine which prospects are most likely to enroll. To do this, you can set up conversion goals to track which leads are progressing and which ones aren’t.
Perhaps one of your conversion goals is requesting a school tour. After setting this goal in Google Analytics, you might discover that the majority of visitors taking this action come through organic search and paid social ads. You can then use that data to invest more of your marketing efforts into those channels, where your qualified leads will be.
You can typically gather enough information from the built-in analytics within each of your marketing tools (Google Analytics, your CRM, Facebook Insights, etc.). However, some schools may benefit from additional audience research tools for more detailed insights. For example, a large K-12 school could combine their CRM data with a platform like Claritas to develop highly detailed audience profiles.

3. Segment and Personalize
Once you’ve collected sufficient data on your qualified leads, you can start segmenting your audience into concrete groups and delivering more targeted campaigns. You can create segments based on factors most relevant to your enrollment marketing, such as:
- Grade Level
- Past Interactions (open houses, tours, website downloads, etc.)
- Engagement
- Interests
- Readiness to Enroll
Once you’ve segmented your audience, you can use that data to deliver personalized content that will help move prospects further down the enrollment funnel. Relevant, personalized messages receive much higher engagement than generic messages, so it’s 100% worth your time to leverage your segment data in this way. You can personalize content on virtually any marketing medium including your website, advertisements, email, and even your mobile app.
Let’s say your high school has a segment for each stage of the enrollment process. If one of your leads in the “inquiry” stage attends an open house but has not taken any steps since then, you can send an email campaign thanking them for their attendance and offering a private tour. Or perhaps you have a segment for those pursuing your school’s STEM program, so you create an ad for the program that can be retargeted to your prospects’ social media later on.
4. Track Campaign Trends
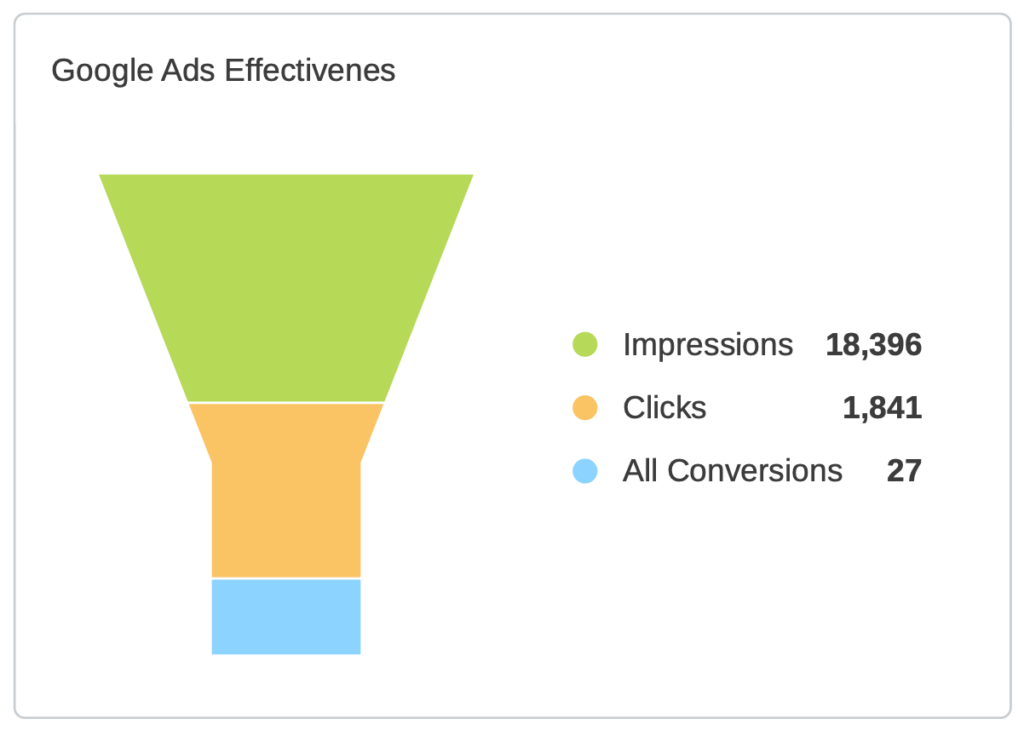
When it comes to assessing your campaign performance, data is the most useful item in your toolbelt. You can view analytics on your emails, social media posts, and ads to see which campaigns are engaging your prospects, and which ones need improvement. Once you’re aware of your campaign’s key metrics (click-through rates, conversions, impressions, etc.), you can start A/B testing to make improvements.
For example, maybe one of your “welcome” email campaigns to new prospects was largely ignored. You could A/B test different versions of your subject line, design, content, or delivery time to track which versions perform better than the original. Additionally, you can track social media metrics such as the number of likes, comments, and shares your posts are receiving. Once you’ve identified the top-performing posts, you can uncover common themes and use those elements to improve your other posts.

5. Monitor Website Content
Your website is the main place prospects will advance in the enrollment funnel, so it’s important to look at how key pages on your website are performing. How long are visitors staying on your website? What pages are they visiting most often? What terms are they searching for? What conversions are they taking (downloads, contact forms, scheduling tours, etc.)? Use the answers to these questions to determine which pages are performing well and which ones aren’t, so you can make improvements.

For instance, if you see that many of your visitors are manually searching the term “extracurriculars” on your website, it could mean this section is not easily accessible through your site’s navigation. You can use that information to move your extracurriculars page to a more accessible place and see if the page needs any SEO improvement.
If you’re looking for more detailed website data, Google Analytics has several features to help. Building UTM codes in Google Analytics, for example, allows you to see where your website traffic is coming from on a granular level. UTM codes can tell you exactly where your visitors came from, down to the specific Facebook post or advertisement. Additionally, you can also consider features like Google Optimize, which allows you to A/B test different versions of your landing pages to assess which ones perform better according to your specific goals.
Simplify Data Reporting with Enrollytics™️
If you’ve been trying to leverage data in your enrollment marketing, you know that filtering through multi-channel reports isn’t as straightforward as it sounds. Extracting data from your website, social media, email and advertisements into cohesive strategies is no easy task, especially for larger schools. That’s why marketing teams are turning to data reporting tools like Enrollytics™ to help you organize and interpret the key findings of your marketing data. Imagine all relevant insights in one cohesive platform. The best part? Enrollytics is specifically designed for school marketers, so you won’t have to bother with the guesswork required in other data reporting tools.
Interested to know more? Contact us for details.


